You've published the annual report, emailed the brochure and uploaded the white paper. People download them, but you still can't tell whether readers found the relevant chart, understood the product differences or reached the contact details. Before redesigning those documents, ask a more useful question: what does the reader need to do inside them?
What B2B Interactive Content Means
A buyer downloads a 40-page annual report, skims it on a laptop and forgets it within a week. The evidence was inside. The route to it was not clear.
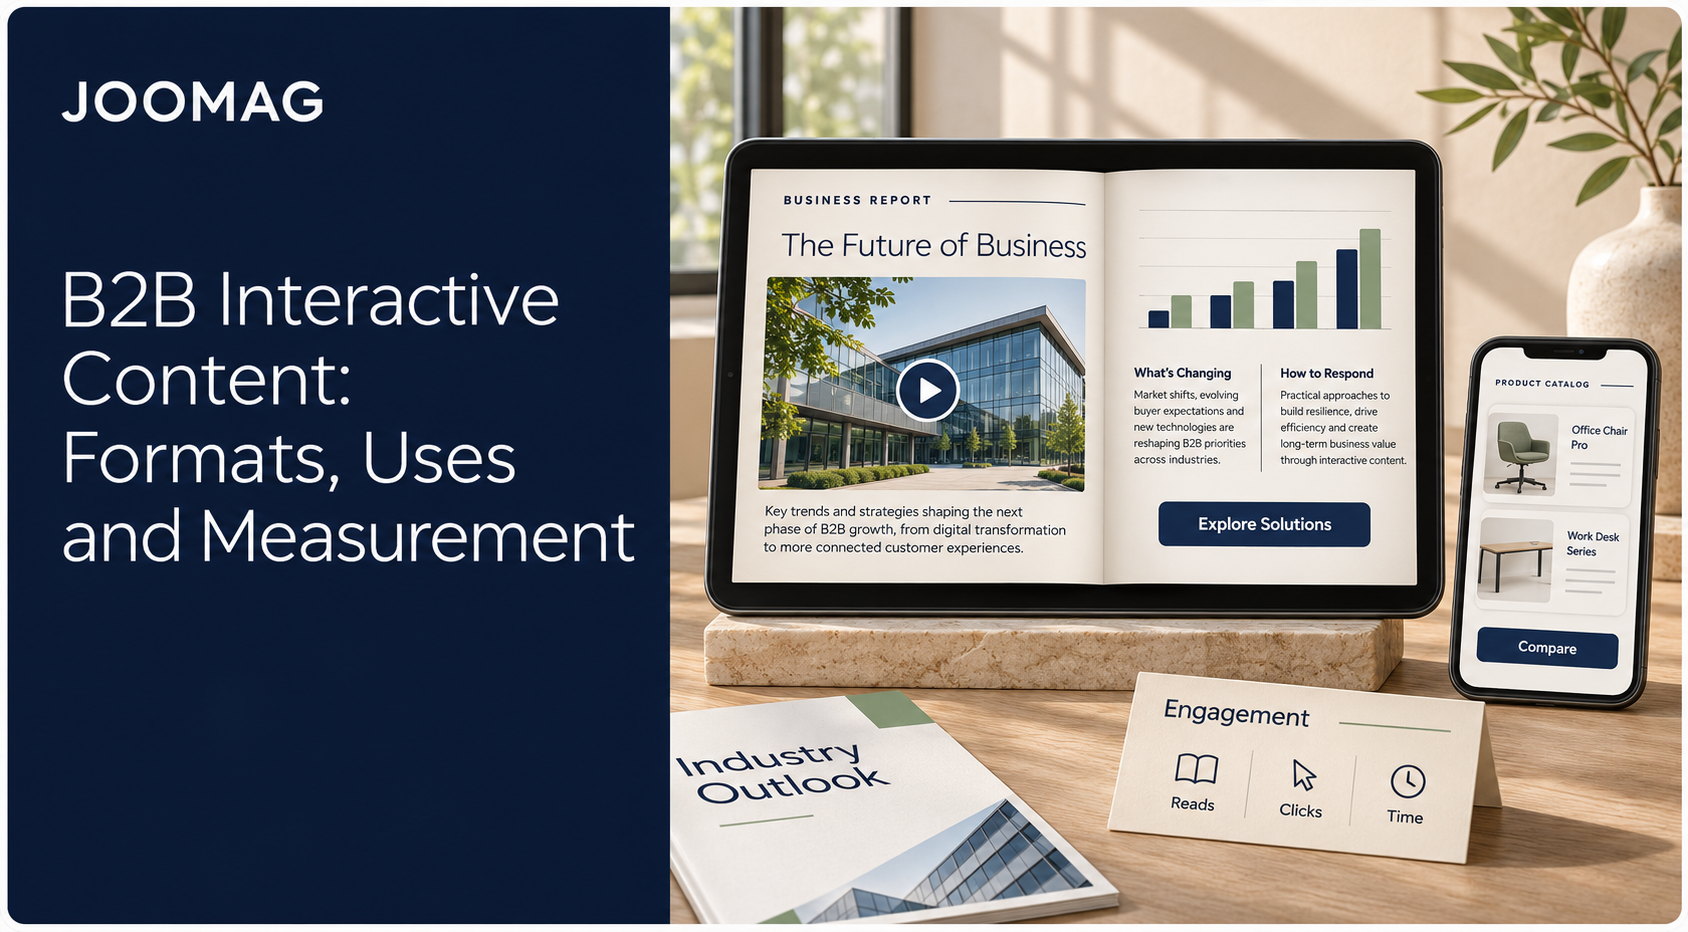
B2B interactive content lets readers act on business information rather than read it straight through. In long-form publishing, that covers reports, white papers, brochures, sales collateral, digital magazines and product catalogs that add navigation, media, explorable data and relevant next steps.
A static PDF works like a bound binder. It holds one fixed sequence, even when readers search or skip pages. An interactive document works like a building with signposted rooms. A finance lead can enter the results section directly. A technical buyer can go straight to specifications without passing through everything else.
Practical rule: Start with the question a reader needs answered, then choose the interaction that helps them answer it.
A reader might jump to an appendix, filter a chart, play executive commentary, open a technical sheet or submit a request. None of those actions turns a serious business document into a game. The useful change is reader control, not novelty.
Industry benchmarks consistently show lower adoption for interactive content than for video, data visualization or e-books and white papers. That smaller share is a reason to be selective. Plan each element around a reader objective, track it as an event, and check that an accessible fallback exists before you publish.
Choose interaction when someone needs to explore findings, compare products, request information or reach a relevant section fast. It earns its place when the reader completes a useful task more clearly than the original document allowed.
Static PDFs Versus Interactive Digital Documents
Read this comparison from left to right: the feature, how a conventional static PDF handles it, and what a deliberately designed interactive version can offer.
Static PDF versus interactive digital document
| Feature | Static PDF | Interactive digital document |
|---|---|---|
| Navigation | Page by page, scrolling or search | Chapter menu, bookmarks and internal links |
| Data exploration | Fixed charts with printed values | Interactive charts readers filter or hover over |
| Video and audio | Linked out or absent | Embedded video and audio on the page |
| Calls to action | Printed contact details | Clickable CTAs and lead forms placed at the right point |
| Reader behavior data | Download counts only | Page views, clicks, video plays and form events |
| Updates | Reissue a new file to every reader | Update one master and republish |
| Mobile reading | Often requires zooming and scrolling | Mobile-optimized layout |
| Best for | Printed, filed or signed records | Documents readers must explore before they act |
The table describes typical publishing workflows, not absolute file-format limits. PDFs can contain links, bookmarks and forms, and a hosted PDF viewer may collect additional analytics. Equally, an interactive publication won't become mobile-friendly just because you upload it.
The differences readers notice
Navigation changes how quickly someone reaches relevant material. A procurement lead shouldn't have to scroll past the company history to find delivery requirements. Clear chapter names and internal links give them a direct route.
Data exploration changes what readers can investigate. A fixed chart presents the editor's chosen view; a filterable chart lets a regional manager inspect their market. Keep the chart's context visible so filtering doesn't hide important qualifications.
Calls to action change where the next step appears. A contact address on the final page asks readers to remember their question until they get there. A contextual request button lets them act while the evidence is still in view.
The production trade-off
Interactive documents require more testing, media preparation and maintenance. Someone must own the live master, check embedded resources and preserve an accessible alternative. Updating the master also doesn't recall copies readers have already downloaded.
Keep a static PDF when the main task is printing, filing or signing. Choose an interactive version when readers need to investigate before deciding what to do.
Formats That Turn a Report Into a Guided Experience
A procurement lead opens a 60-page report with one question about delivery terms. The format decides whether she finds it in ten seconds or gives up on page four. Start with navigation, then add only the elements that clarify difficult material or support a decision.
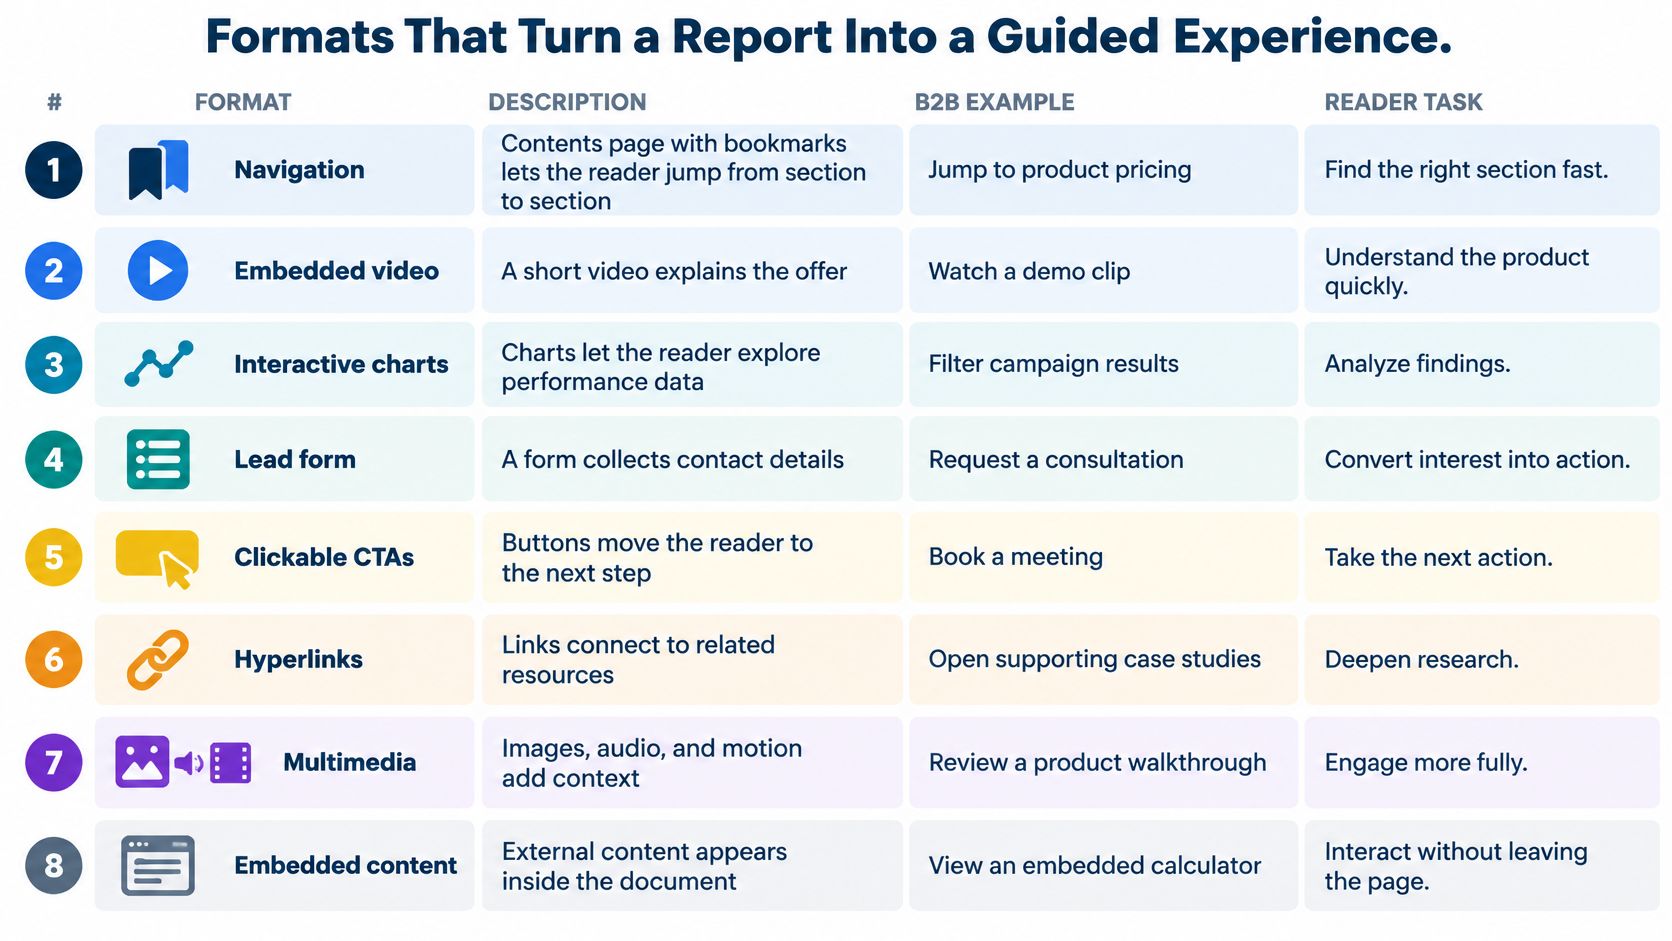
Interactive elements, B2B examples and accessibility rules
| Element | B2B example | Reader task | Accessibility rule |
|---|---|---|---|
| Navigation | Contents page and bookmarks in a hypothetical 60-page report | Jump from summary to appendix | Bookmarks work as navigation aids |
| Hyperlinks | Executive summary linked to the supporting chart | Check a claim without losing context | Link text names its destination |
| Embedded video | Executive commentary beside the financial section | Hear the meaning behind the numbers | Provide captions and a text equivalent |
| Multimedia and embedded content | Case-study video or linked webinar | Find proof from a customer | Content still works when media is off |
| Animations | Short, skippable process explainer | Understand a sequence of steps | Motion can be paused or skipped |
| Interactive charts | Bar chart filtered by region or year | Explore data relevant to their market | Offer the underlying values as text |
| Clickable CTAs | Request a consultation button after the ROI chart | Act once the evidence is seen | Button text describes the action |
| Lead forms | Short request form after the evidence | Ask for a demo or quote | Fields have descriptive labels |
Match the element to the question
Hyperlinks work when readers need evidence, not another explanation. Link a product claim directly to its technical sheet, and provide a clear return route when the destination sits elsewhere in the document.
Embedded video suits demonstrations and commentary that benefit from a human voice. Place the explanation beside the relevant passage, rather than making readers leave the report to search a video library. Multimedia and embedded content brings customer proof into that same reading context, so the reader can compare the claim and the proof side by side.
Use animations for sequences, such as showing how a component moves through a manufacturing process. Keep them short and skippable. For interactive charts, display the selected filters and units so readers know exactly which view they are examining. Each choice becomes a measurable event: which filter was used, which video was finished, which CTA was clicked.
Make the next step understandable
Place clickable CTAs after supporting evidence, not indiscriminately across every page. A short form should explain what the reader will receive and request only information the receiving team will use.
The W3C PDF accessibility techniques identify bookmarks, descriptive link text, labeled form fields and content that remains usable when interactive mechanisms are unavailable. Apply that underlying principle to every element, alongside captions, text alternatives and controllable motion.
The editorial test is simple: does this element answer a question the reader has at this point? If removing it changes nothing useful, leave it out.
Where Interactive Documents Earn Their Place
Interactive document use cases
| Document | Reader objective | Interactive elements | Signal to track |
|---|---|---|---|
| Marketing report | Understand the findings and request a consultation | Interactive charts and a consultation CTA | Chart interactions and CTA clicks |
| Annual report | Assess performance and leadership direction | Chart drill-downs, leadership video and section links | Section reads and video completion |
| Sales brochure | Compare products and choose a next step | Feature pages linked to demos and product pathways | Path taken and demo requests |
| Customer magazine | Find case studies and stay engaged | Editorial links to case studies and embedded content | Article reads and return visits |
| Product catalog | Find the right model and specifications | Filterable specs, linked spec sheets and a rep CTA | Product page views and spec downloads |
| Investor communication | Verify financial data and management commentary | Hyperlinks to evidence, data charts and a short video | Time on the financial section and return visits |
These documents can reuse material teams already produce. In the Content Marketing Institute's 2024 B2B benchmark, 84% of B2B marketers used video and 71% used long articles. Bringing those assets together can preserve editorial depth while reducing the work readers must do to connect them.

Choose according to the decision
For a marketing report, the challenge is interpreting findings. Let readers explore a relevant segment, then offer a consultation about applying it. Don't force a form submission just to understand the headline conclusion.
An annual report serves readers with different priorities. Section links separate strategy, operations and financial performance, while leadership commentary explains decisions without replacing the underlying statements. Investor communications need especially direct routes from management claims to supporting evidence.
A sales brochure should help buyers distinguish options. Connect feature pages to demonstrations and relevant proof, rather than sending every reader to the same general homepage. Treat sales enablement as support for a specific buying conversation, not another distribution channel.
Preserve the purpose of each publication
A customer magazine still needs strong editorial judgment. Link an implementation story to the detailed case study for readers who want evidence, but don't turn every article into a sales pitch.
For product catalogs, prioritize specifications and model selection. A buyer who knows the required capacity should reach the appropriate model, confirm compatibility and contact a representative without retracing their steps.
None of these use cases needs a quiz. The interaction works because it helps someone interpret, verify, compare or proceed.
Measuring Clicks, Reading Time and CTA Results
A pricing page that gets steady traffic but few CTA clicks tells a different story than a proof section no one reaches. The table below gives each metric a job, so a spike or a silence points to a reader task instead of a vague win.
Metrics for interactive business documents
| Metric | What it tells you | Signal to watch | Caveat |
|---|---|---|---|
| CTA clicks | Whether readers take the next step | Clicks relative to CTA exposure, by section | Clicks alone do not show buying intent |
| Page or article engagement | Which sections hold attention | Pages reached, scroll depth and sections opened | Long sessions can reflect confusion |
| Reading time | How long readers spend on key sections | Time on pricing or proof sections | Open tabs inflate totals |
| Video interactions | Whether media supports the message | Play rate and completion rate | Autoplay inflates play counts |
| Chart and tool use | Which data readers explore | Filter changes and drill-down clicks | Only meaningful when tied to a task |
| Form completion | Efficiency of lead capture | Starts compared with completions per form | Completions without fit produce weak leads |
| Return visits | Sustained interest across the buying group | Repeat readers from known accounts | Needs identified readers to be useful |
Read these measures as clues, not verdicts. A long stay on specifications can mean careful evaluation or a reader struggling to locate an answer. A video play means little until you separate deliberate starts from autoplay and check completion.
In practice, interactive documents often attract more views and longer reading sessions than static files. Treat that lift as a starting point for analysis, not as proof of pipeline growth.
Build an event model before publishing
Give every tracked interaction a consistent name and useful context. Record the document version, section, element and action so analysts can distinguish a navigation click from a demo request.
- Start and progress: Record experience starts and step completions where the document contains a guided sequence.
- Choices and results: Capture answer categories and result views when a relevant embedded tool uses them.
- Actions and continuity: Track CTA clicks, shares and return visits, subject to the reader's permissions.
Use document analytics for digital publishing to examine paths as well as totals. Readers who repeatedly leave before the proof section may need a clearer entry point, not a more prominent contact button.
Separate attention from qualification
Where readers are identified appropriately, join events to contacts and account records. This lets the team distinguish a champion's repeated reading from engagement across finance, operations and technical stakeholders.
Keep account fit, engagement intensity and buying-stage evidence separate in scoring. An account may match your target market and consume substantial content without showing an active buying need. A long session alone should not trigger sales qualification.
Short sessions deserve the same discipline. A two minute visit that ends on a pricing CTA with a completed short form can outweigh a 20 minute browse with no next step.
Compare static and interactive versions with matched audiences, offers and distribution conditions. Look beyond clicks to meetings, opportunity creation, progression and closed revenue, while acknowledging other campaign influences.
Measurement discipline: More recorded behavior is useful only when it changes a decision about content, follow-up or account priority.
How to Plan an Interactive Brochure or Report
Plan the reading experience before placing media on the page. Otherwise, you can spend the production budget adding features while leaving the original navigation problem untouched.
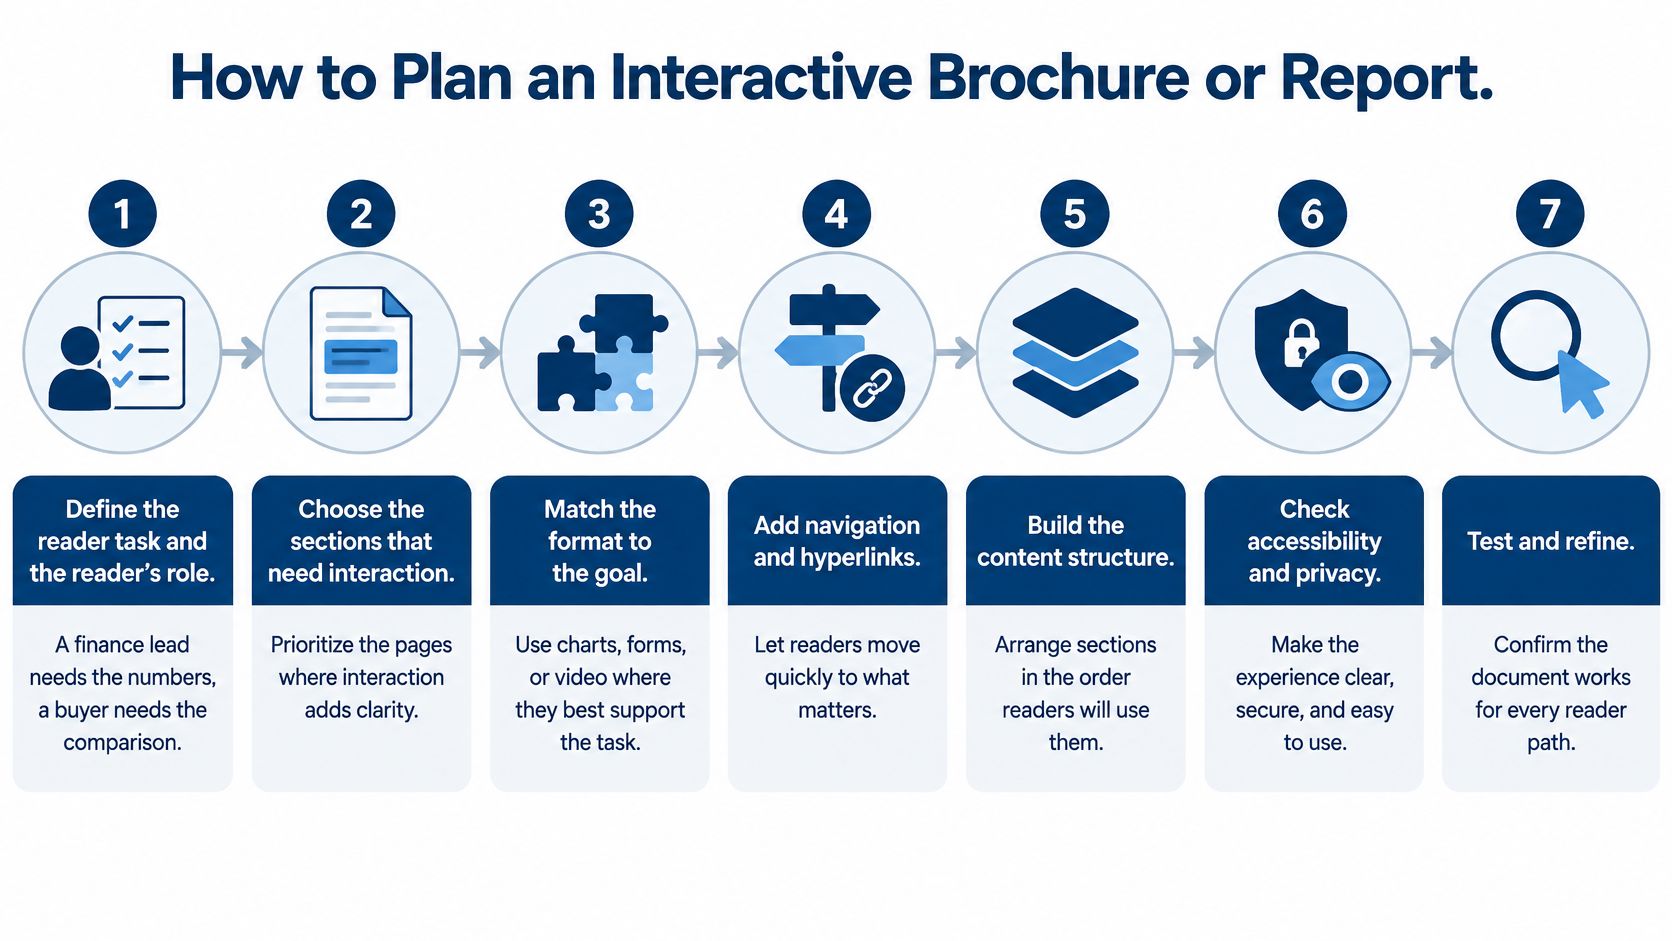
Build from the reader's job
- Define the task and role. Write a practical statement such as: the finance lead must verify the assumptions before approving a discussion. A buyer comparing models needs a different route from an executive reviewing strategic direction.
- Select sections that need exploration. Mark the charts, comparisons and proof points where reader choice adds clarity. Leave straightforward explanations as linear text, because not every paragraph needs a control.
- Import the PDF and establish navigation first. Add the chapter menu, bookmarks and internal links before charts or video. Test whether someone unfamiliar with the document can find the relevant section without help.
- Place a contextual next step. Use a primary CTA where the section provides enough evidence to act, and keep any associated form short. Explain whether the reader is requesting a demonstration, a quote or a conversation so the outcome isn't ambiguous.
- Create a governed master for repeat versions. For regional or account-specific brochures, separate approved design from changing data. In our Joomag content automation workflow, users choose a company-approved master template, then input data manually or from sources such as DAM, CRM or CSV files to generate personalized content.
- Build the accessible alternative alongside it. Prepare a tagged PDF or HTML version containing the same core information. Doing this during production makes missing descriptions, chart values and media transcripts easier to resolve.
- Assign events and a review date. Connect each interactive element to its intended action and name the person responsible for reviewing it. Decide in advance what evidence would justify keeping, changing or removing the element.
Test the delivery conditions
Open the document on a phone and complete the actual reader task. Don't stop at checking that the cover loads: inspect chart labels, form fields, tap targets and the route back from linked resources.
Check website embedding and content-hub sharing in the environment where readers will use them. Corporate browsers, restricted networks and blocked third-party media can produce a different experience from the authoring preview.
Finally, assign a publication owner and an approval route. Confirm who can change financial information, replace a video or publish a revised version, and ensure privacy and access settings match the document's sensitivity. A reliable publishing process matters as much as the initial design.
Accessibility and Privacy Safeguards to Build In
Forrester buyer insights indicate that 58% of surveyed buyers wanted more calculators and self-assessments, while 57% wanted clearer ROI and performance metrics. The useful lesson isn't that every report needs a tool. Buyers need understandable information they can defend internally.
An interactive document isn't better if a member of the buying group can't use it. Accessibility, transparent calculations and restrained data collection protect the usefulness of the experience.

Release checks that protect reader access
- Equivalent information: Provide an accessible PDF or HTML path with the same conclusions, chart values and essential evidence. Don't make video the only source of an important explanation.
- Transparent logic: If an embedded calculator supports a business case, expose assumptions, formulas, units and limitations.
- Usable controls: Test keyboard-only navigation and screen-reader flows, including focus order, form errors and return paths.
- Localized presentation: Check translated labels, text expansion, currencies and regional information rather than translating words alone.
- Minimal collection: Request only fields needed for the output or follow-up, explain tracking and separate anonymous reach from identified account activity.
For confidential investor or internal documents, require authentication or gated access and restrict resulting first-party data to authorized users. Include privacy and access control in publication approval rather than treating security as a distribution detail.
Before release, confirm that the fallback opens, keyboard paths work, translated layouts remain readable, tracking disclosures are accurate and access permissions have been tested. A visually polished document isn't ready until those checks pass.
Decide the Reader Task Before You Publish
Use this decision check before approving an interactive document:
- Who is reading? Identify the role and what they already know.
- What must they accomplish? Name the question or decision.
- What action should follow? Specify the appropriate next step.
- How will you recognize success? Choose observable behavior and a downstream outcome.
For an investor report, the task may be verifying financial claims. Hyperlinked evidence and concise management commentary suit that task better than decorative motion. In a sales brochure, the task may be comparing products, so model-specific routes to demonstrations make more sense.
Pilot a document that already attracts readers. Add a small set of elements tied to a single task, configure tracking and choose a fixed review period before comparing it with the static version.
As a Content Experience Platform, Joomag supports creating and distributing personalized, interactive magazines, catalogs, brochures, proposals and reports. Our access controls and authentication protect private material, while Granular Data tracks user actions, content consumption and engagement metrics.
Make the publishing decision on that basis: interactivity earns its place when it serves the reader's objective, not when it makes the document look busier.
Create B2B Interactive Content With Joomag
Turn the reports, brochures, catalogs, and magazines your team already produces into content readers can explore and act on. Joomag lets you add videos, links, navigation, and lead forms to existing PDFs, placing useful information and relevant next steps together.
Make longer content easier to read on phones with AI-powered article extraction, which transforms publication articles into responsive HTML pages while preserving the original designed edition. Joomag’s accessibility mode in Article View supports screen readers, keyboard navigation, and adjustable text sizes.
Distribute your publications through website embeds, content hubs, direct links, and email campaigns. Use reader analytics to understand which pages attract attention and which links prompt action, then ask Joomag’s AI Agent questions about performance and generate reports for your team.
Book a demo to see how Joomag can make your next report, brochure, or catalog more interactive, accessible, and measurable.