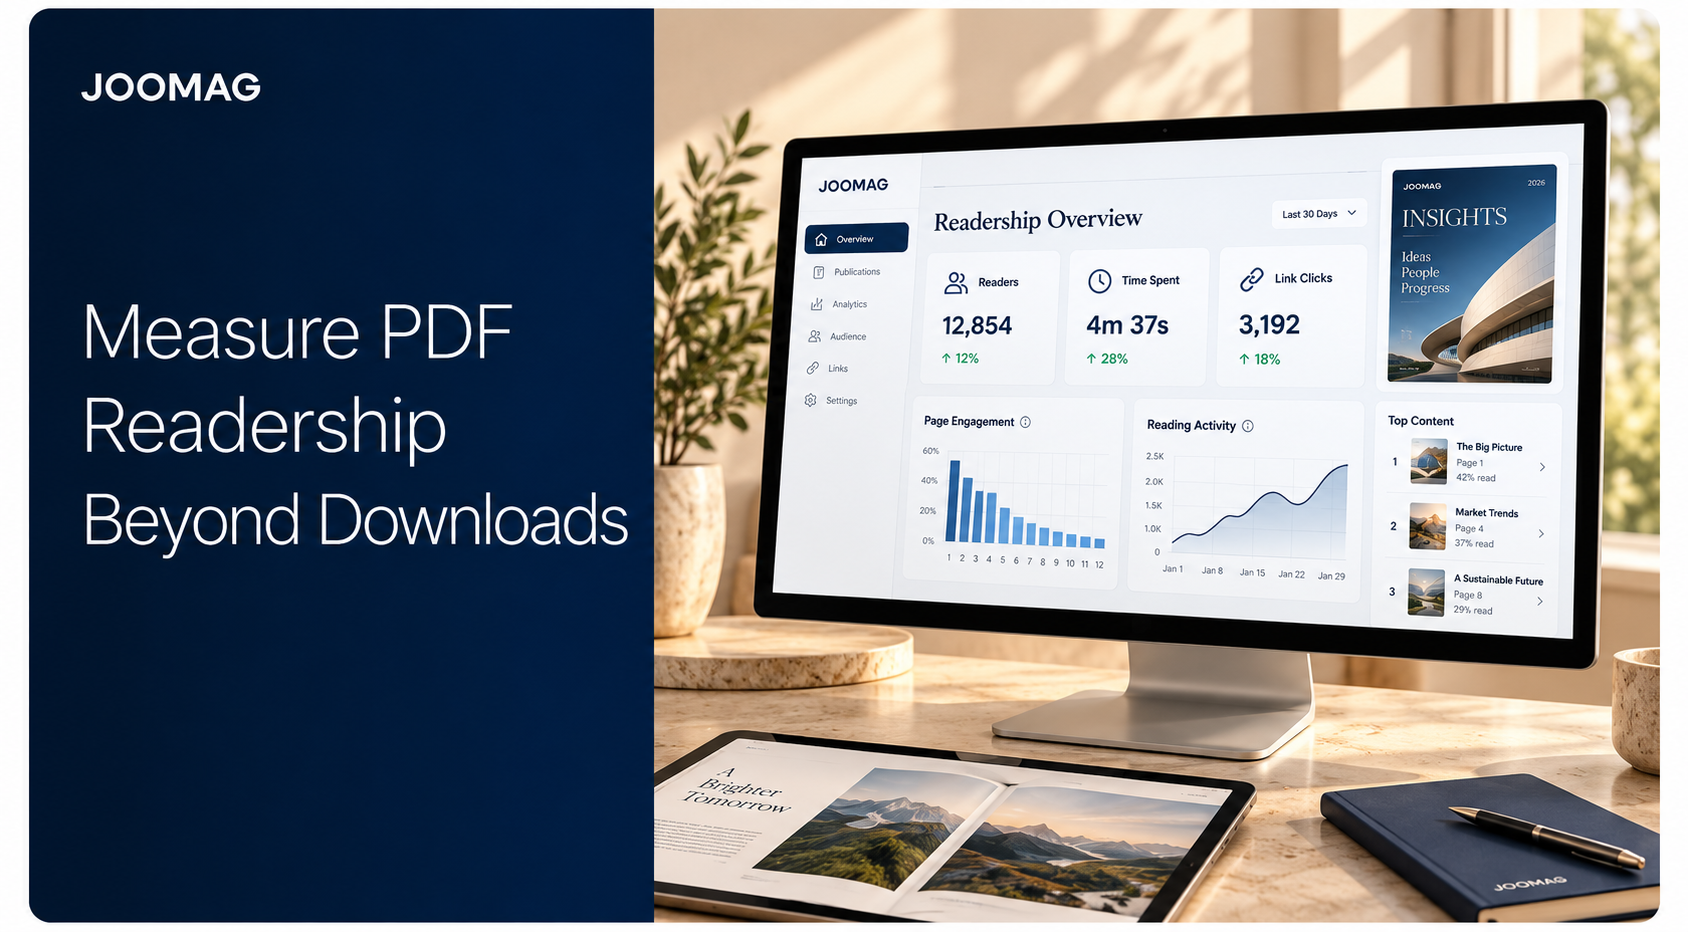
Your monthly report says 400 downloads. Sales asks a simple follow-up. Did anyone reach the offer page?
You can't answer. That's not a reporting failure. It's a measurement limit. A download, a visit to the page that hosts the file, and reading inside an online publication are three different events. Each one answers a different question.
This guide shows you how to track PDF views without overstating what you know. You'll learn how to measure PDF readership by separating access from attention, anonymous reach from named readers, and reading from revenue.
What Download Page and Publication Tracking Show
Start with that familiar report. 400 downloads sounds solid until someone asks which pages people read, how long they stayed, or whether they clicked the demo link. A download total can't tell you any of that.
The download click
A download is a file interaction, not a read. Google Analytics documentation on enhanced measurement events explains that a downloadable-file click can be recorded as a file_download event, with the file name as a parameter, for example annual-report.pdf.
That event proves someone took the file. It doesn't reveal which pages they viewed, how long they spent, or whether they clicked links inside it. Once the file opens in a browser viewer or a local app, your website analytics usually lose sight of it.
The hosting page visit
Your hosting page is a different measurement. Website analytics can record page_view events and on-site click events there. You can see the referrer, device, and campaign that brought the visitor.
From those two numbers you can calculate download rate. Divide downloads by views of the page that hosts the file. That tells you whether the page persuaded people to click. It still says nothing about what happened after the file opened.
The online publication
An online publication keeps the document inside a controlled, instrumented viewer. Because the reader stays in that viewer, you can record page attention, reading time, completion, and link clicks. That's the only one of the three methods that supports a real readership claim.
Practical rule: Downloads prove access. Page analytics prove the visit. Only the publication can show reading.
Three ways to track a PDF and what each one misses
| Method | What it records | What it cannot show | Best question it answers |
|---|---|---|---|
| PDF download or file_download event | Click on the file link, file name, and sometimes page, campaign, device, and referrer | Pages read, time in the file, in-document link clicks, or completion | Did someone take the file? |
| Hosting-page visit | page_view and on-site clicks, traffic source, device, and download rate | Behavior after the file opens locally or in a generic browser viewer | Did the web page attract the click? |
| Online publication | Page views, unique or active readers, time, completion, and internal or external link clicks | Automatic proof of a named person or of revenue | Did people actually read and act inside the piece? |
Match the method to this week's question. If you only need to know whether a file was taken, a download event is enough. If you need to know whether the content was read, don't publish a download total as if it were reading.
Website Analytics Against Publication Analytics
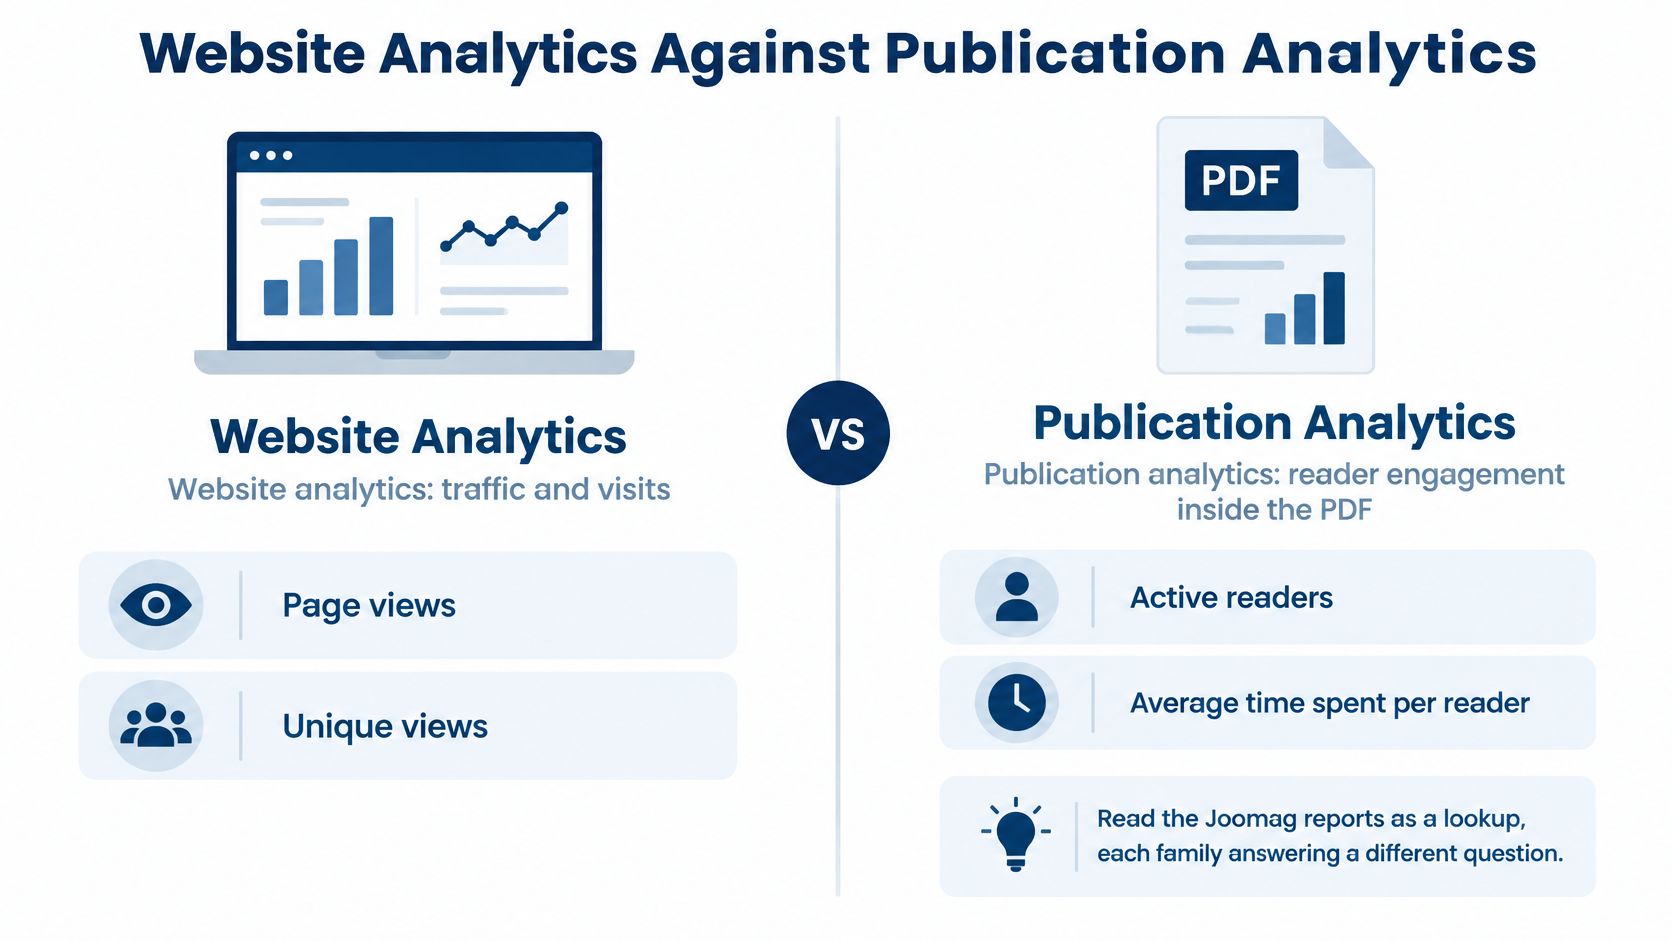
Website analytics and publication analytics aren't competitors. They cover different ground. Website analytics remains your source for the hosting page, its sessions, its referrers, and the click that started a download.
Publication analytics starts where that trail ends. It measures what happens inside the piece itself.
Reading the Joomag reports as a lookup
Treat each report family as an answer to one question. Joomag's analytics documentation describes Content reporting with page views, unique views, active readers, average time spent per reader and per publication, and bounce rate. Behavior reporting covers reader engagement, audio and video performance, internal and external link performance, and retention rate.
Reading progress shows how many people started, had not started, or finished a publication, along with average completion time and average completion rates. Acquisition separates direct, campaign, referral, and organic search traffic.
Joomag publication reports and the question each one answers
| Report | Metrics documented | Use it to learn |
|---|---|---|
| Content | Page views, unique views, active readers, average time per reader and per publication, bounce rate | How much of the piece drew attention |
| Behavior | Reader engagement, audio and video performance, internal and external link performance, retention rate | What people interacted with and whether they came back |
| Reading progress | Started, not started, finished, average completion time, average completion rate | How far readers got |
| Acquisition | Direct, campaign, referral, organic search | Where the visit came from |
Use Acquisition first when your question is traffic. Which campaign sent these readers? Which referral source performed?
Use Content and Behavior first when your question is reading. Did people get past the cover? Which pages held them? Which links earned clicks?
One limit applies to every figure in these reports. They describe aggregate or anonymous readership unless your organization adds an identification or authentication mechanism. A reader count isn't a list of known people, and you shouldn't present it as one.
Anonymous Readers Versus People You Can Name
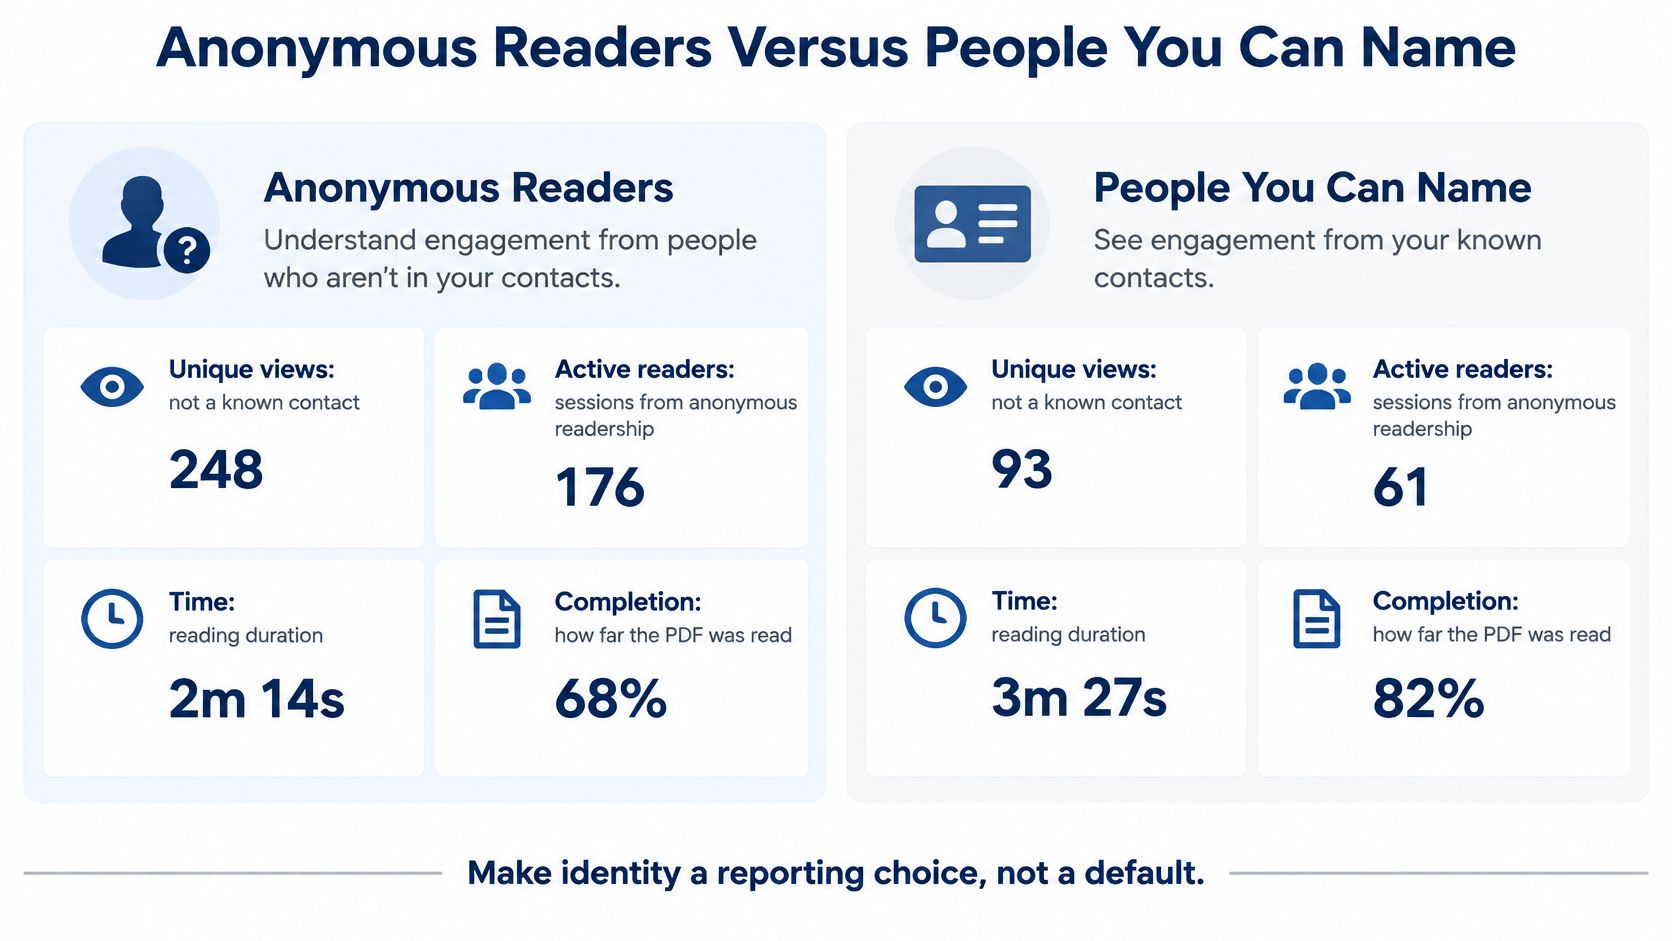
Identity is a reporting choice, not a default. Unique views, active readers, time, and completion describe sessions. A unique view isn't a known contact.
A reader becomes identified only when you add a mechanism, such as a form or sign-in. Joomag identifies readers using first-party data or forms, and our data capture forms are one way to make that step deliberate. Until someone completes that step, label them anonymous.
What the Kantar case shows
The MarketingSherpa case study on digital content reports that Kantar's 2019 PDF report was estimated at about 2,000 readers, but the organization could not reliably determine how many people received the report through colleague-to-colleague sharing or physical copies. After moving to an interactive document format with measurable engagement, its next edition reportedly reached 28,000 readers, while the 2023 edition recorded 35,000 engagements in six months, and only 6% of readers downloaded the PDF version.
Read those numbers carefully. They're one organization's case, not a promise for your next brochure. The lesson is about visibility. The old PDF hid sharing. The measurable format made engagement observable, and it also showed that downloading was a minority behavior.
When only a small share of readers download, a download report describes the minority and calls it the audience.
Report separate lines instead of one blended number. Track access, unique visits, repeat visits, depth where your viewer measures it, downloads, shares where known, and conversion actions.
Then keep two column labels in every report. Anonymous reach goes in one. Identified readers goes in the other. Never move a number from the first column into the second because it would look better there.
Reading Signals and Accessibility Segments
A reader opens your publication during a meeting, scrolls through a few pages, then leaves. An open count records access, but it cannot show whether the reader explored the content. Event-level tracking adds detail, though each signal has limits: a scroll suggests movement, not attention, and a click shows an action, not understanding.
Build a simple event schema
Record consistent fields for each event. This gives analysts a way to group activity into stages instead of treating every open as reading.
Reading event schema and what each field enables
| Field | Purpose |
|---|---|
| Document ID | Ties events to one publication across sessions |
| Reader or session ID | Links dwell and clicks within one visit; anonymous unless identified |
| Page or region | Shows where attention and clicks happen |
| Timestamp and dwell interval | Measures time and active reading |
| Event type | Separates scroll, click, search, selection, and comment |
| Device and referrer | Explains friction and traffic source |
Use the fields to define your funnel:
- Exposure: The page was reached and rendered. This records access, not attention.
- Active reading: Dwell time passed a threshold your team sets and documents. Time alone cannot prove that someone read the page.
- Navigation friction: Repeated backtracking or quick exits may signal difficulty, but can have other causes.
- Explicit engagement: A click, search, text selection, or comment records an action, not the reader's intent.
A page rendered in a browser tab is not necessarily being viewed. A documented dwell threshold helps separate a loaded page from a session that meets your definition of active reading.
Accessibility changes what a short session means
A brief session may reflect a document access barrier rather than low interest. The study of 2,500 PDFs from Swiss repositories found that about 11.5% contained tags, 13.1% had a hierarchical heading structure, and 10.8% had both. These figures describe the studied PDFs, not every publication. Many PDFs may lack tags or alternative text, making their structure harder for assistive technologies to convey.
Tags and headings expose document structure and support nonvisual navigation. Without them, a screen reader user may leave quickly. The session metric shows a short visit, but does not explain whether the content was inaccessible.
Where your viewer supports it, segment sessions using signals such as screen-reader-compatible access, keyboard navigation, heading jumps, and downloads of remediated versions. Compare completion and return rates by accessibility status, while treating those measures as indicators of usability rather than a reader's identity.
Do not infer disability from a session. Measure whether the document works for different ways of reading. Before publication, check tags, reading order, headings, and image alternatives with automated tools, then validate a sample using a screen reader.
Campaign Tags Without Fake CRM Credit
A tagged link answers a narrow question: where did a visit come from? It does not identify every reader or assign revenue. Keep those measures separate.
Tag the online publication
Name each piece clearly, then add campaign, source, medium, and content parameters to every distributed link. This helps acquisition reports distinguish direct, campaign, referral, and organic search traffic.
Use consistent labels across channels. If email and paid teams use different values for the same launch, reporting splits one campaign into separate rows. Agree on the naming before distribution.
Tag the conventional PDF
For a plain PDF, record the tagged link click as a download event. Store the initiating page, destination URL, campaign, device, and referrer with it. This records what the click confirms: a person reached the link and clicked to download. It does not show whether the file was opened or read.
Supported third-party tagging can pass campaign context to analytics tools your team uses. Joomag's integrations with other tools page shows available connections. Check the supported options rather than assuming a connection is available.
State the limits plainly
Tagging doesn't create automatic CRM attribution, so say that limit in the report itself, not in a footnote nobody reads. A campaign tag is a label on the route, not proof that a particular person or opportunity produced revenue.
For example, a tagged brochure link can show which campaign brought readers to the publication. If a reader submits a form, the response can provide identifying information. Your team can then reconcile that response in its CRM using its established process. Keep anonymous sessions in publication reporting, separate from named readers and commercial credit.
Aggregated, anonymized usage patterns may be shared with customers, partners, and service providers. They describe groups, not a list of named people, so they cannot establish individual CRM attribution.
Tag the click, report the source, and leave commercial credit to the system that owns the opportunity.
Measure a Sales Brochure in Four Stages
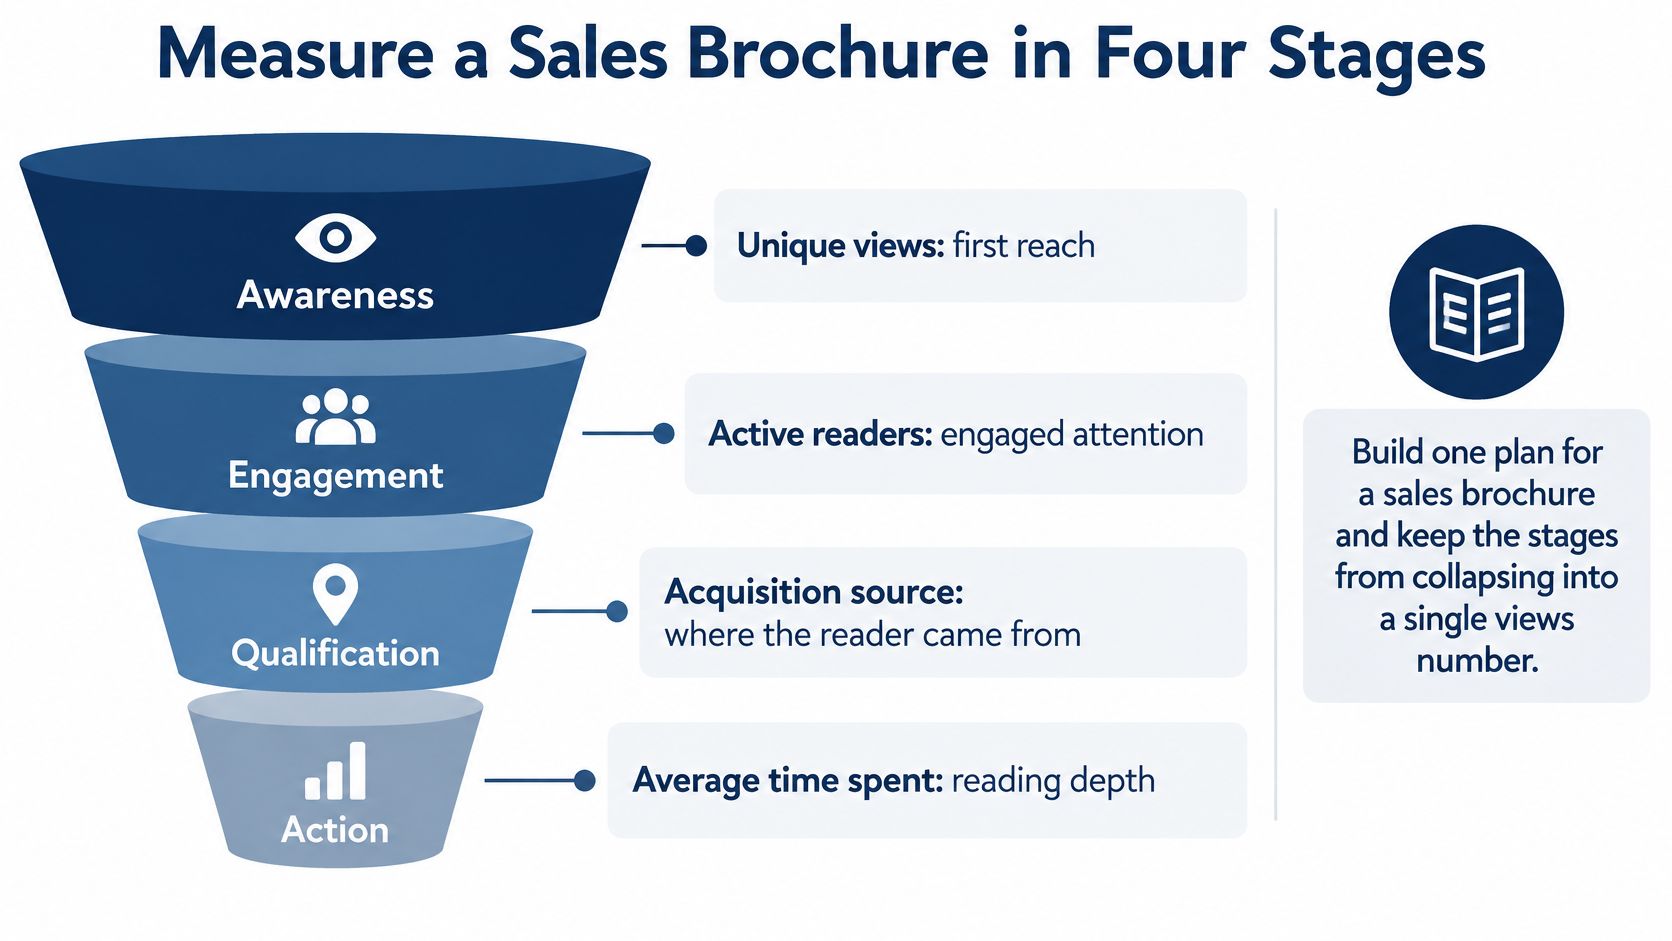
A brochure gets a download, a hosting-page visit, and in-publication engagement. Each answers a different question. Keep anonymous reach separate from named readers, and keep both separate from revenue. The four-stage framework in Joomag's digital magazine creator playbook helps teams report these signals without treating them as interchangeable.
The four stages
Attention measures reach and arrival: unique views, active readers, acquisition source, and average time spent. These metrics show whether traffic arrived and stayed, but they do not identify every reader or prove that every page was read.
Interaction measures activity inside the brochure, such as page engagement, completion or retention, and internal or external link clicks. These signals show what readers explored. They do not prove that a reader booked a meeting or made a purchase.
Inquiry records tracked contact actions, such as form submissions or booked meetings. Business outcome covers qualified opportunities, pipeline, revenue, or closed deals matched through your organization's own systems. Publication engagement alone cannot establish that match.
Sales brochure measurement from attention to outcome
| Stage | Signals to report | Example for a sales brochure | What it is not |
|---|---|---|---|
| Attention | Unique views, active readers, source, average time spent | Campaign traffic that stays past the cover | A named lead or proof of a full read |
| Interaction | Page engagement, completion or retention, internal and external link clicks | Long dwell on pricing and a click to book a demo | A meeting or a deal |
| Inquiry | Form submissions, booked meetings, or other tracked contact actions | A completed meeting request from the brochure | Automatic CRM credit |
| Business outcome | Qualified opportunities, pipeline, revenue, or closed deals matched in the team's own systems | A deal sales can connect to that inquiry | Something the publication report proves by itself |
One brochure, walked through
A prospect arrives from a campaign link and reads beyond the cover. That is attention. She spends time on the pricing spread and clicks the demo link. Those are interaction signals, useful to sales because they show which topic drew her interest. Time on a page is not evidence of purchase intent by itself.
She then completes the meeting form. That creates an inquiry and identifies a reader. Later, if a deal closes, count it as a business outcome only when sales records the connection in its own system.
A busy pricing page is not pipeline. A reader might be a competitor, a student, or a prospect who never buys. For account teams, Joomag's sales enablement tools let reps track how each prospect engages with every page, giving them a follow-up aid rather than proof of a deal.
Get Answers Faster With Joomag’s AI Agent
Once you’re collecting publication engagement data, your team needs a practical way to use it. Joomag’s AI Agent lets you ask questions about publications, readers, acquisition channels, and email campaigns in plain language.
Ask which publications performed best last month, compare campaign results, or explore how engagement changed between editions. Follow-up questions let you narrow the analysis without rebuilding a report from scratch.
You can also generate reports in PDF, Excel, PowerPoint, or Word to share with colleagues. This helps your team move from collecting metrics to deciding which content to promote, improve, or revisit.
Readership Tiers That Do Not Invent Revenue
A sales brochure gets shared. Later, someone on your team says the brochure was well read, so it belongs in pipeline. That jump feels natural and is still a leap. The Content Marketing Institute's 2025 B2B benchmark reported that 56% of marketers struggle to attribute ROI to content, and the same percentage struggle to track customer journeys. A single download or view is a weak basis for a source claim, because it records contact with a file, not a buying decision.
Report five tiers, in order
Replace the single score with tiers that each make a smaller, defensible claim:
- Exposure: The piece was reached.
- Verified consumption: Readers spent real time and progressed through pages.
- Account engagement: Multiple sessions or stakeholders from a target account engaged.
- Intent signals: Readers clicked offer links, returned, or completed a contact action.
- Downstream outcomes: Opportunities or deals your own systems recorded afterward.
Keep that order. A report that jumps from tier one to tier five asks the reader to trust a gap. Move the brochure one tier at a time. A campaign link brings a prospect in, she reads past the cover, then spends time on the pricing spread. That is tier two. Clicking the demo link is tier four. The meeting form makes her known, still not revenue. Only the CRM can supply tier five.
Volume is not value
A modest read by the right buying group can matter more than a high-volume file that never reaches a decision. The reverse also happens. A named account may show little tracked readership yet still progress because a decision-maker forwarded the piece or discussed it in a meeting. Offline sharing moves deals without appearing in your viewer.
So say it plainly in the report. Correlation is not influence. A brochure read before a deal closed may have helped, accompanied, or had nothing to do with it.
The useful question isn't how many people read it. It's whether the intended audience consumed the intended material before a milestone the business can already measure.
One more caution. If a short session makes you suspect mobile friction or an inaccessible file, treat that as a usability question. Don't collect sensitive traits or infer disability to explain it. Fix the document and measure again.
Leave the revenue number in the CRM. Your readership tiers supply the context that makes that number interpretable. They don't replace it.
Run the PDF Reporting Checklist
Apply this list before any PDF readership report leaves the team.
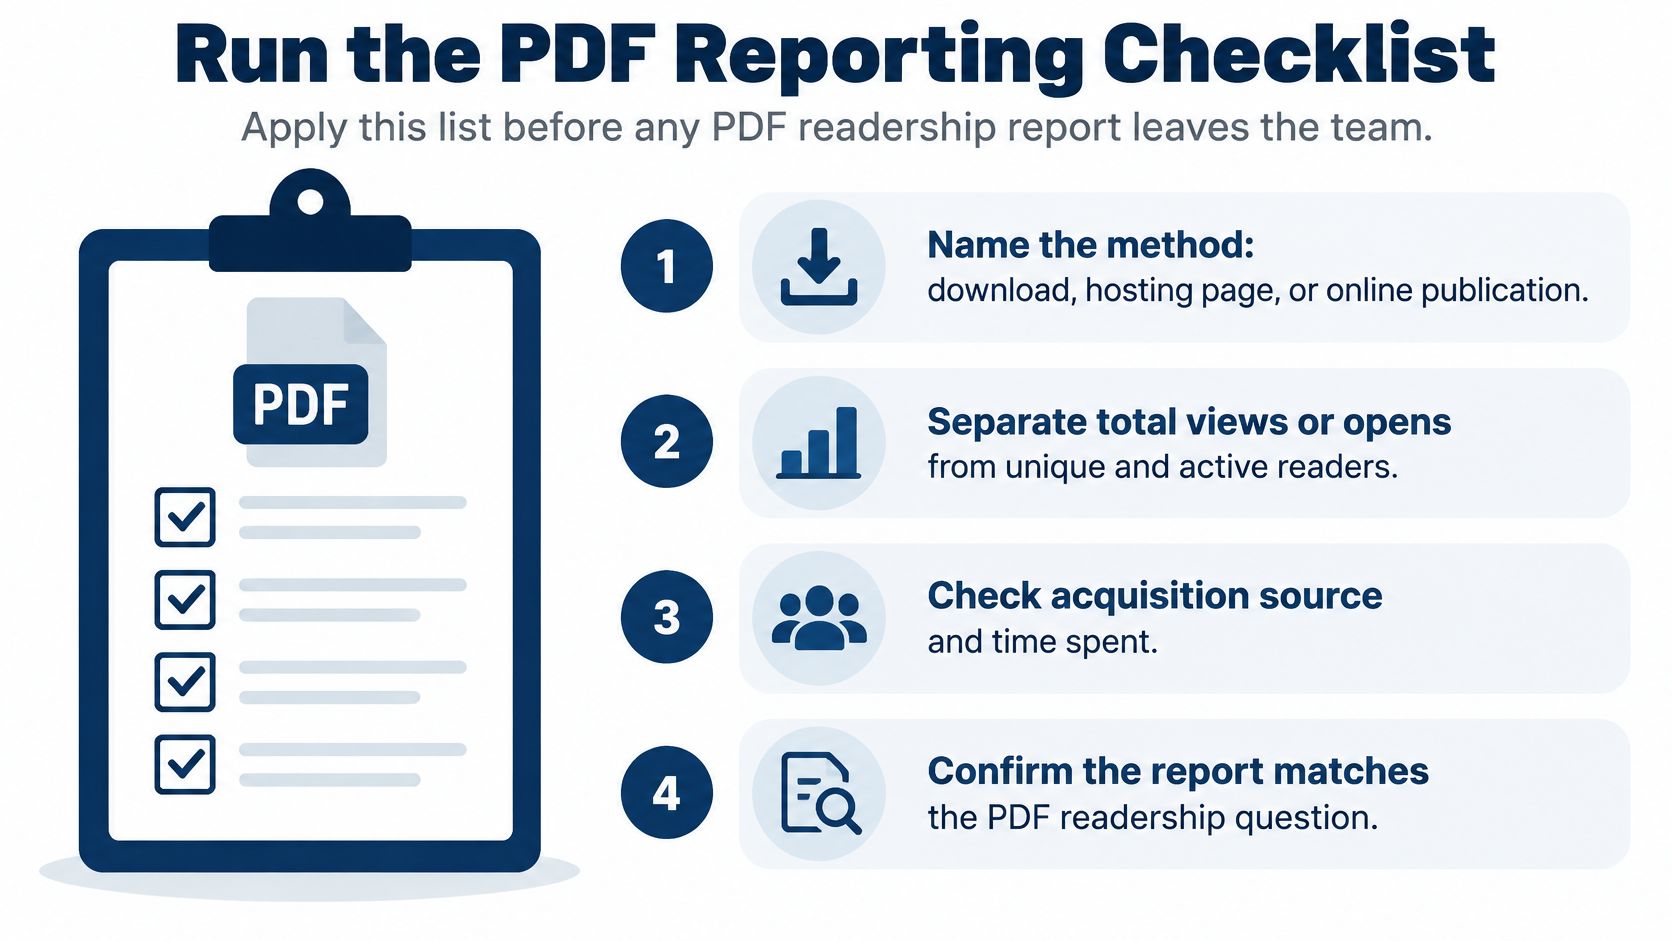
- Name the method: Download, hosting page, or online publication.
- Separate totals: Keep total views or opens apart from unique and active readers.
- Report only captured data: Show time, completion, and page engagement only where the viewer captured them.
- Split link clicks: Separate internal and external link performance.
- Keep identity apart: Anonymous reach and identified readers never convert into each other.
- Show campaign source: Include it wherever parameters exist.
- Separate inquiries: Count them apart from pipeline, revenue, and closed deals.
- State attribution limits: The report doesn't claim automatic CRM attribution or a native RB2B or Vector integration.
- Mark unmeasured sharing: Note offline copies and forwarding as unmeasured when they matter.
- Leave blanks blank: Any stage with no data stays empty.
For your next step, host the sales piece as an online publication. Then the checklist has page, time, and link data to fill instead of gaps to explain. Joomag is trusted by more than 5,000 customers and millions of users, and our results section lists a 250% increase in reader engagement and a 140% increase in reader return rate.
Those figures describe listed results, not a guarantee for your brochure. The decision in front of you is simpler. Stop leading with downloads. Lead with the stage you can defend.
Understand How Readers Engage With Your PDFs With Joomag
Go beyond the download count. Joomag turns existing PDFs into interactive online publications, giving your team visibility into page engagement, reading time, reading progress, and link activity.
See which content attracts attention, which channels bring readers, and where the experience could improve. Use Joomag’s AI Agent to explore the results and create reports that help your team plan its next release.
Book a demo to see how Joomag can help you measure engagement with your magazines, catalogs, brochures, and reports.